Crypto market review Q2 2026 data shows that cryptocurrency prices had a rough time throughout the quarteR. Bitcoin closed June near $58,000, dropping by 18% on the month, levels not seen since late 2024. Ethereum finished down 25%, its third straight losing quarter, something that’s never happened before in its history.
ETH went down below $2,000 in June and closed at around $1,747. Fear and Greed settled at an extreme fear for most of the three months.
While prices fell, stablecoins grew to a new all-time high of $323B. RWA tokenization crossed $28.9B. Mastercard acquired BVNK for $1.8B, and JPMorgan launched its second tokenized fund on Ethereum. Hyperliquid went from 32% to 63% in the perp market share.
The GENIUS Act moved into implementation, MiCA hit its final compliance deadline, and Japan passed legislation cutting crypto taxes. The money that left crypto through ETF outflows went mostly to AI stocks.
Also, Read Crypto Market Report Q1 2026
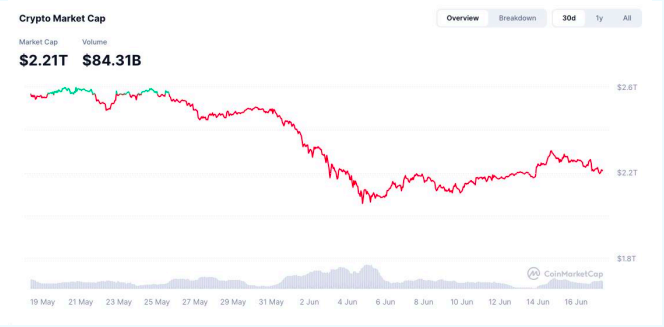
Crypto Market Q2 2026 Performance
- Total global cryptocurrency market cap opened April at $2.85T
- Briefly hit $3.1T – driven by stablecoin growth and early ETF inflows
- Dropped to $2.75T, bounced, then fell again as ETF outflows picked up in June
- GENIUS Act and CLARITY Act news pushed it briefly to $2.9T–$3.0T
- Closed the quarter around $2.21T
- Fear and Greed Index averaged 22 throughout Q2
- Bitcoin dominance ranged between 52% and 57%
Top Gainers Q2 2026
- HYPE – hit ATH of ~$75.52 on June 1; up 1,675%+ since launch
- ZEC – rallied to ~$624 in early June on Grayscale ETF filing news
- AI-adjacent infrastructure tokens select names outperformed on narrative
Top Losers Q2 2026
- ETH – down 25% for the quarter; closed at around $1,747
- BTC -down 18% in June alone; closed near $58,000
- ZEC – crashed 50% on June 5 after critical Orchard pool vulnerability disclosure
- DeFi tokens – down 44% as a category
- Layer-2 tokens – down 49% across the board
- NFT marketplace revenue- down 82%
Bitcoin Faces $61,000-$71,000 Volatility in Q2
Bitcoin price entered Q2 trading around $68,000. It survived early US-Iran tensions and the closure of the Strait of Hormuz. But it lost ground when liquidity rotated into the SpaceX IPO, and after ETF outflows began. BTC briefly dropped to nearly $61,000 before bouncing to around $64,000 on the US-Iran peace framework news.
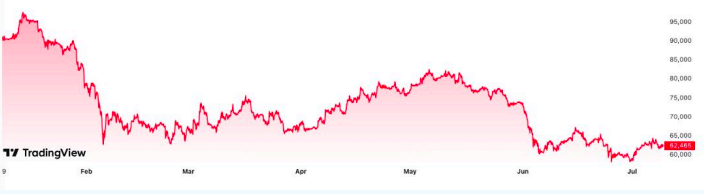
From May 6 through June 30, ETFs were negative on 39 of 41 trading sessions, with about $8.9B total flowing out. Bitcoin slid from around $80K to $58K through that stretch, which heavily impacted the short-term Bitcoin price forecast.
The pressure escalated upon news of Strategy’s sale of 32 BTC at the end of May. Even though the amount was small, the market cared more about what it meant than what it was worth.
Crypto Market Review Q2: Ethereum Finishes Down 25%
Ethereum price had it worse than Bitcoin. ETH fell below $2,000 in June and closed at approximately $1,747. It experienced losses in three consecutive quarters, something that has never happened in ETH’s history.
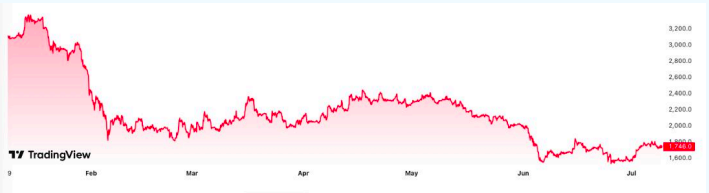
The main drivers were delays to the Glamsterdam upgrade, heavy institutional selling, and concerns that Layer 2 networks are eating into Ethereum mainnet revenue. ETH/BTC kept going lower, and the question of why, went unanswered.
Looking for new opportunities? Check out our Top Altcoin Picks for July 2026
ETF Flows: Best Month, Then the Worst Month on Record
April was the best month of 2026 for Bitcoin ETF inflows, recording $2.02B. May flipped to -$2.41B, then June became the worst month since launch in January 2024. Total Q2 net outflow was approximately -$4.67B.
Ethereum ETFs saw a 17-day consecutive outflow streak following early May, with total assets falling to roughly $9.96B by June. Solana ETFs went the other direction, reaching $115.3M in inflows in May alone, zero outflows, and total assets increasing to $1.13B.
Looking to invest in Bitcoin E TFs? Explore the Top-rated platforms
Exchanges: Hyperliquid’s Market Share Doubled in One Quarter
Total Q2 exchange volume came in at approximately $11.28T. Spot contributed around $2.6T, while futures and perps brought in $8.87T. Hyperliquid’s perp DEX share rose from 32.76% in Q1 to 63.29% by mid-June, strengthening its position among the leading decentralized futures exchanges, HYPE hit new all-time highs while the broader market fell.
Q1 vs Q2 Exchanges performance (Source: CoinGape, Data: The Block)
Coinbase crypto perps reached $211B in cumulative volume across 25 contracts, one year on from CFTC approval. Pre-IPO perp futures emerged as a new category, with Bitget, Binance, Gate, OKX, and BitMart all launching products around the SpaceX and Anthropic listings.
Stablecoins Hit $323B
According to the Crypto market review Q2 2026 data, Stablecoins hit a new all-time high of $323B in Q2, which stands out because everything else in the market was falling. Total volume came in at $4.5 trillion, keeping the growth run going that started in late 2025. USDT and USDC together now hold over 80% of the entire stablecoin supply, about $261B combined.
That level of concentration has regulators paying close attention. MiCA’s July 1 deadline and the US GENIUS Act are now pushing capital away from non-compliant issuers toward fully audited, asset-backed ones like Ripple’s RLUSD, PayPal’s PYUSD, and Circle’s Euro-backed EURC.
If you’re holding stablecoins and want to put them to work, here are some ways to earn with your stablecoin holdings.
Last 4 Quarters Stablecoins Trajectory (Volume) (Source: CoinGape, Data: DefiLlama)
Non-USD stablecoin volume hit its own record at $2B, up more than 40% in 2026. Stablecoins kept growing because demand for dollar-denominated on-chain payments doesn’t follow the Bitcoin price.
RWA Tokenization Crossed $28.9B
Tokenized real-world assets grew to cross $28.9B even as crypto markets fell. US Treasuries remained the biggest category. Top RWA tokenization platforms like Circle/Hashnote and BlackRock BUILD contributed around $3.1B, and $2.7B, respectively.
Major Tokenization Assets Categories Growth (Source: CoinGape, Data: RWA.XYZ)
Tokenized equities reached $5.5B, pushed there by the SpaceX IPO on Ondo and xStocks platforms. RWA keeps growing through bear markets because institutions need yield and collateral, and that doesn’t stop when Bitcoin goes down.
Crypto Market Review Q2 2026: Worst Quarter on Record for Hacks
There were around 83 exploits and $755M stolen in Q2. KelpDAO and Drift Protocol accounted for over 75% of losses, both linked to North Korea’s Lazarus Group. Cross-chain bridges were responsible for 46% of total losses. The attacks came through infrastructure and human error, not smart contract bugs.
TradFi and Regulation: Q2’s Structural Story
Traditional finance kept building into crypto despite the price drop. Mastercard acquired BVNK for $1.8B. JPMorgan launched JLTXX, its second tokenized fund on Ethereum.
Visa reached a $7B annualized run rate on stablecoin settlements and joined the Canton Network as its first super validator. America’s biggest banks announced a shared tokenized deposit network targeting mid-2027.
Most major crypto IPOs for Kraken, Grayscale, Ledger, and Consensys were pushed back as SpaceX, OpenAI, and Anthropic took over market attention.
The Crypto Market Review Q2 shows that the CLARITY Act passed the Senate Banking Committee 15-9, and the GENIUS Act moved into implementation. MiCA’s July 1 deadline split EU operators between compliant and non-compliant. Japan classified crypto as a financial product and cut taxes on gains.
Prediction Markets: Over $50B Monthly Volume
The crypto market review 2026 data reveal that the prediction market volume reached $50.69B monthly by June. The best crypto prediction markets like Kalshi and Polymarket contributed about 25.7 billion in total. Kalshi had the largest market share of 58% at $17.9B, and Polymarket had around $8.8B.
Top Prediction Markets by Volume (Source: Coingape)
The leading category here is Sports, pushed there by FIFA World Cup markets. Both platforms launched perpetual futures, according to the Crypto Market Review Q2, and
Galaxy Digital launched the first OTC prediction market service for institutional investors.
Top Prediction Categories by Market Share (Source: Coingape)
Crypto Market Q3 2026: What to Watch
Bitcoin ended the second quarter below its 200-week moving average. The $58,000-$65,000 range is where early July plays out. Fed Chair Warsh commented on July 2, that inflation risks had eased. BTC bounced to $61,000 the same day. June jobs numbers came in at 57,000, well below the 113,000 expected. If hiring keeps slowing down like this, the Fed is more likely to cut interest rates, which would be good for crypto.
Ethereum’s Glamsterdam hard fork and Solana’s Alpenglow consensus upgrade are the two protocol upgrades to look out for.
Q3 events to watch include WebX Tokyo (July 13-14), Korea Blockchain Week, Solana Breakpoint London, Token2049 Singapore, European Blockchain Convention Barcelona, and Devcon 8 Mumbai.
Conclusion
The crypto market review Q2 2026 shows that the period was rough on price. But the top performers were stablecoins hitting $323B and RWA reaching $28.9B,. Hyperliquid doubled its market share, TradFi kept building, and three major regulatory jurisdictions clarified their rules. The money that left through ETF outflows went to AI stocks, not out of risk.
List of Companies Profiled in This Report
- BlackRock
- Binance
- Coinbase
- Tether
- Strategy (formerly MicroStrategy)
- Stripe
- Fidelity Investments
- Polymarket
- Ondo Finance
- …and 30+ more companies covered across DeFi, exchanges, payments, RWA, and AI sectors
Want to know which upgrades and events could move prices in Q3? Check the full CoinGape Crypto Market Review Q2 2026 for the complete rundown.